Next-Level Reporting Methods for Higher Ed Marketing
Overcome reporting challenges by integrating your data – effectively
In a previous blog, we shared the four biggest challenges we’ve seen with our clients when it comes to producing full-funnel enrollment reports and how to overcome them. Read about them here.
In this post, I’d like to show you what happens when you integrate and centralize your marketing and enrollment data. Here at MindMax we’ve developed a full-funnel, integrated-platform view of students’ marketing and enrollment journey, how they engage throughout the process, and what happens as they enroll. We call it, “Enrollment Intelligence.” This platform aggregates and simplifies complex data, empowering you to make strategic, data-driven decisions. This information can help you and your team to plan next year’s budget, or to adjust your current ad spend allocation based on performance.
Visually represent your data
Below is an example of a dashboard from our Enrollment Intelligence platform. We develop dashboards based on feedback from our team and our clients. Data is pulled in from systems such as a CRM system, a marketing operations system, Google Analytics, Google AdWords, Facebook, and call center data. This platform gives you the ability to drill down further in any of the individual charts.
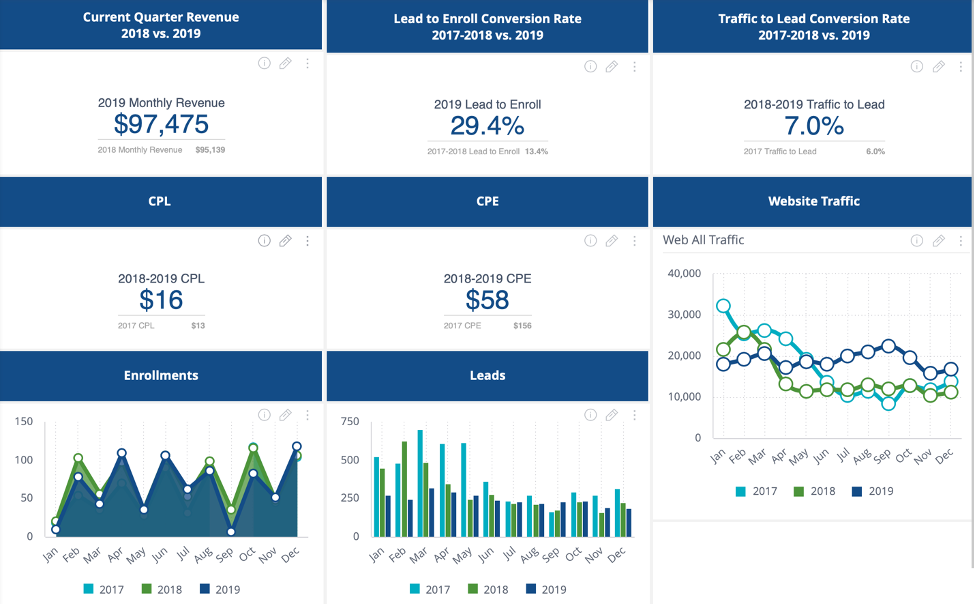
With Enrollment Intelligence (EI), you can find the answers to questions like:
- How much should we spend on ads this year?
- Which campaign led to the highest lead conversion rate?
- What’s our average cost to acquire a new student?
Have you ever wanted to know how your average cost per lead (CPL) compares to your average cost per enrollment (CPE) – but by program? With Enrollment Intelligence, it’s possible. In the dashboard below, notice the variations between the programs.
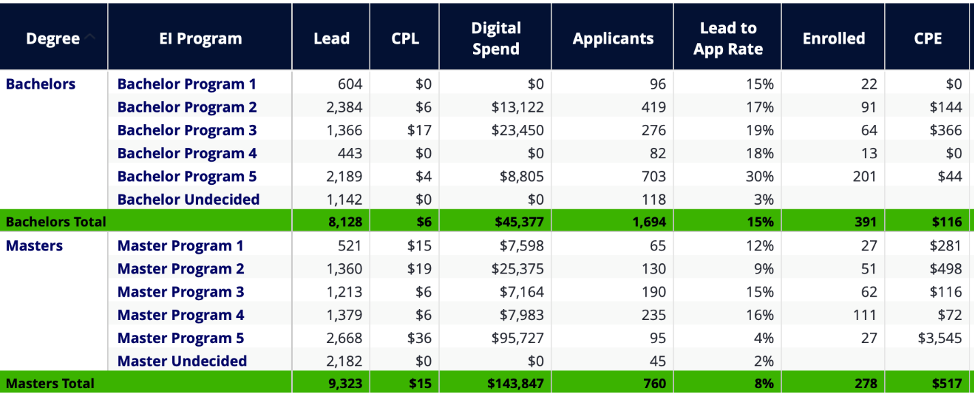
Understanding the cost per lead and cost per enrollment for each program would be valuable information to have for planning next year’s budget and marketing strategy.
Discovering data insights
With the right data and analysis in place, you can gain powerful insights about enrollment trends—whether they are positive or negative.
Here are examples of data insights from the MindMax Enrollment Intelligence platform.
First, the snapshot below provides a year-over-year comparison of the lead-to-enroll (LTE) conversion rate. We can see that this conversion rate improved significantly from 13.4% in 2017-2018 to 29.4% in 2019.
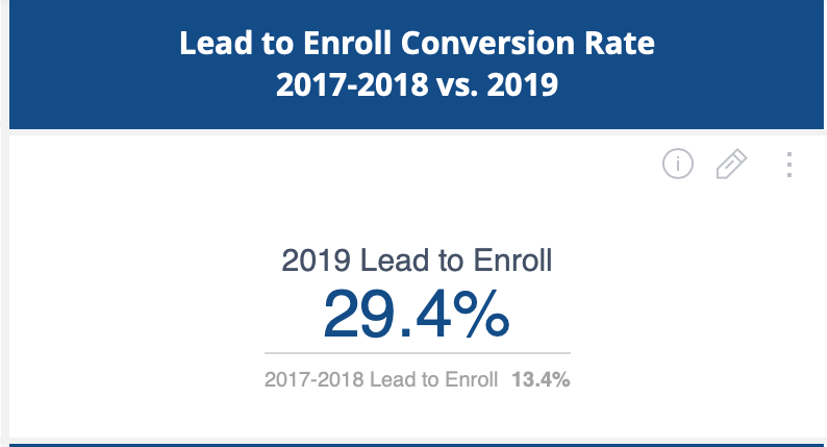
The important question is “why?” We want to understand what marketing tactics contributed to this increase so we can continue tactics that will bring optimal returns. In some cases, however, we want to uncover why something is performing poorly so it can be remedied.
In this second example, we can see that Facebook ads created significantly more leads in 2017. However, enrollments increased as the digital advertising spend shifted from Facebook to Google AdWords. After analyzing the data and insights, and receiving qualitative feedback from the call center team, we learned that the Facebook leads were top-of-the-enrollment-funnel leads. These leads were spending time researching but were not close to deciding to enroll.
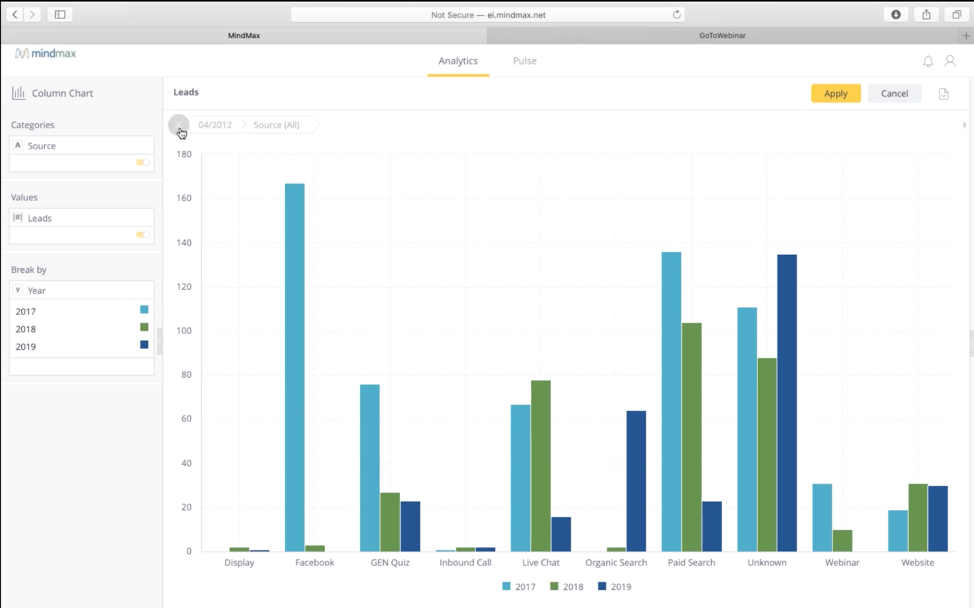
This valuable insight enabled us to shift to marketing tactics that delivered more enrollments and contributed to the improved lead-to-enroll conversion rate and a decreased cost per enrollment (CPE).
Takeaway
With your data connected and aggregated, you can gain powerful insights about enrollment trends, ad spend allocation, lead conversion rates, revenue to date, and much more. Most importantly, you will have real-time quantitative information to make more effective marketing decisions. To learn more and to see additional examples, watch our on-demand webinar, Connecting the Dots: How to Use Your Marketing and Enrollment Data to Make Better Decisions.
Related Ideas
Will OPMs Adapt to Meet Evolving Demands in Higher Education?